Monitoring & Observability for Solo Developers: Go + GCP
I run Amida-san (amida-san.com), a web service with 20,000+ users, as a solo developer. The backend is written in Go and deployed on GCP.
In the previous article, I covered the CI/CD pipeline. This article focuses on monitoring, logging, alerts, and admin tooling—the systems that keep the service running reliably.
A service being “up” and a service being “stable” are two different things. Detecting issues early, identifying root causes quickly, and responding effectively—that’s what this monitoring stack is built for.
Architecture Overview
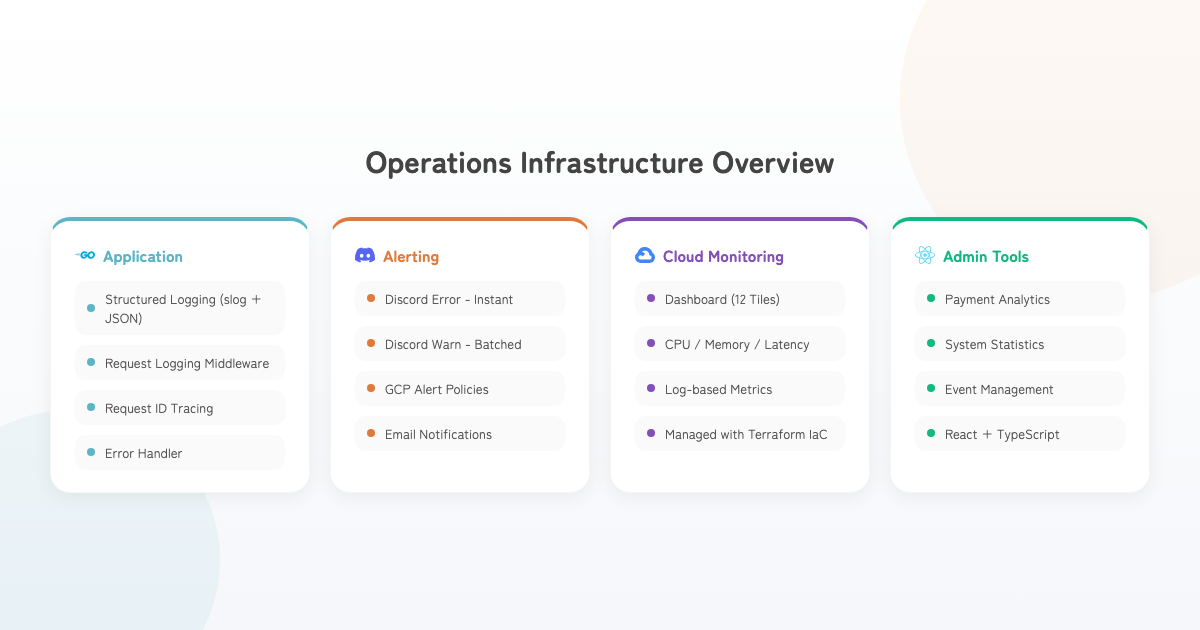
Structured Logging with slog
Why Structured Logs?
Text-based logs make it difficult to trace what happened after the fact. Structured logs enable field-level filtering and aggregation in Cloud Logging.
I adopted log/slog, added to Go’s standard library in Go 1.21.
Unified Log Functions
// Consistent log output across all layers
shared.LogInfo(ctx, shared.ComponentInteractor, shared.OpCreateEvent, "Event created",
    shared.LogKeyEventId, event.ID,
    shared.LogKeyUserId, userID)

shared.LogError(ctx, shared.ComponentRepository, shared.OpDBQuery, "Query failed", err,
    shared.LogKeyEventId, eventID)
All log output goes through four functions: LogInfo / LogWarn / LogError / LogDebug. Each automatically attaches:
- Component name (Router, Interactor, Repository, etc.)
- Operation name (CreateEvent, DBQuery, etc.)
- HTTP context (request ID, endpoint, method, remote address, user agent)
- Source information (file name, line number)
Log Level Strategy
Each layer uses appropriate log levels:
| Level | Usage |
|---|---|
| Info | Normal operations, user input errors (validation, 404, permission denied) |
| Warn | Repository-layer Not Found, system concerns (external API delays, retries) |
| Error | Critical system failures (DB connection failures, unexpected errors) |
To avoid duplicate logs, the rule is: log at the Repository layer, skip duplicate logging at the Interactor layer.
Request Logging Middleware
func RequestLoggingMiddleware() gin.HandlerFunc {
    return func(c *gin.Context) {
        start := time.Now()
        ctx := c.Request.Context()

        shared.LogInfo(ctx, shared.ComponentRouter, shared.OpRequestStart,
            "Request started")

        c.Next()

        duration := time.Since(start)
        statusCode := c.Writer.Status()

        if statusCode >= 500 {
            shared.LogWarn(ctx, shared.ComponentRouter, shared.OpRequestCompleted,
                "Request completed with server error",
                shared.LogKeyStatusCode, statusCode,
                "duration_ms", duration.Milliseconds())
        } else {
            shared.LogInfo(ctx, shared.ComponentRouter, shared.OpRequestCompleted,
                "Request completed successfully",
                shared.LogKeyStatusCode, statusCode,
                "duration_ms", duration.Milliseconds())
        }
    }
}
All requests are logged at start and completion, with log levels switching based on status code. 5xx responses use Warn (triggering Discord notifications), while others use Info. The middleware uses Warn rather than Error because the actual error source (Interactor or Repository layer) already logs at Error level—avoiding duplication while enabling per-request anomaly detection.
Request ID Tracking
func HTTPContextMiddleware() gin.HandlerFunc {
    return func(c *gin.Context) {
        requestID := c.GetHeader("X-Request-ID")
        if requestID == "" {
            requestID = generateRequestID() // Random 16-char hex
        }

        ctx := context.WithValue(c.Request.Context(), keys.RequestID, requestID)
        c.Header("X-Request-ID", requestID)
        c.Request = c.Request.WithContext(ctx)
        c.Next()
    }
}
Request IDs are automatically attached to all logs and returned in response headers. This enables cross-cutting traceability for any single request.
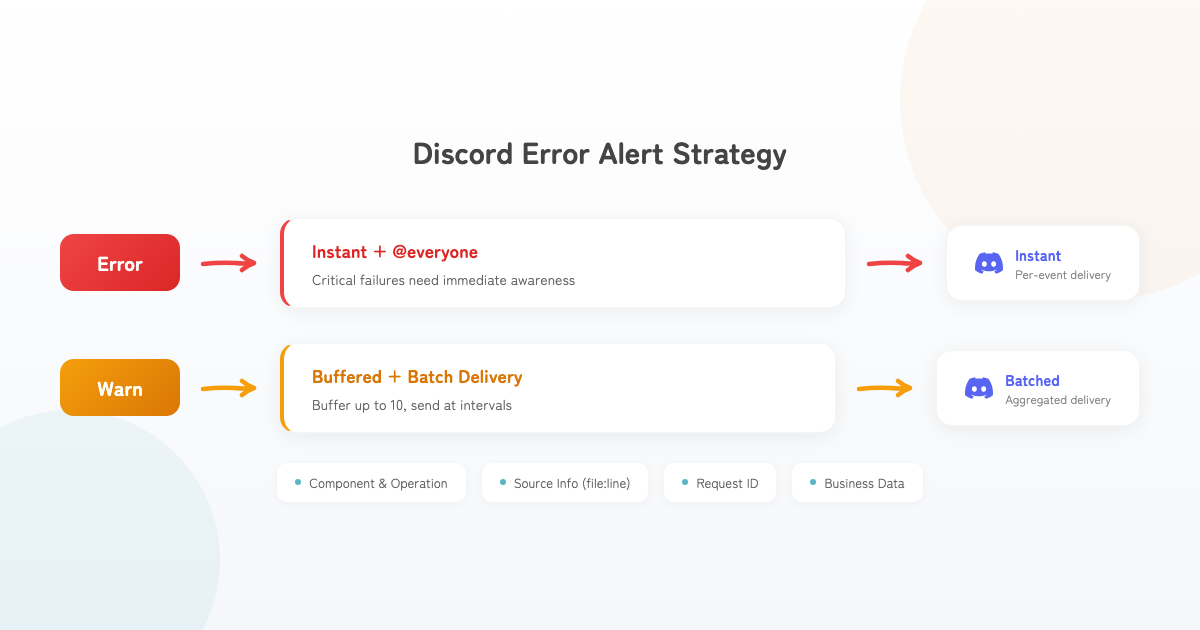
Discord Error Alerts
Cloud Logging requires you to actively check for issues. As a solo developer, you need a system that pushes notifications to you when something goes wrong.
Error vs. Warn Notification Strategy
// LogError → Immediate Discord notification (@everyone)
func LogError(ctx context.Context, component LogComponent, operation LogOperation,
    message string, err error, keyValues ...interface{}) {
    logWithLevel(ctx, slog.LevelError, component, operation, message, err, keyValues...)

    if globalDiscordConfig != nil && globalDiscordConfig.Enabled {
        SendDiscordErrorAlert(ctx, globalDiscordConfig.WebhookURL,
            component, operation, message, err, keyValues...)
    }
}

// LogWarn → Buffer and batch send at intervals
func LogWarn(ctx context.Context, component LogComponent, operation LogOperation,
    message string, keyValues ...interface{}) {
    logWithLevel(ctx, slog.LevelWarn, component, operation, message, nil, keyValues...)

    if globalDiscordConfig != nil && globalDiscordConfig.Enabled {
        SendDiscordWarnAlert(ctx, globalDiscordConfig.WebhookURL,
            component, operation, message, nil, keyValues...)
    }
}| Level | Notification Method | Reasoning |
|---|---|---|
| Error | Immediate + @everyone | Critical failures need instant attention |
| Warn | Buffered + batch send | Prevents webhook flooding during spikes |
Warn Buffering
Warnings are buffered up to 10 entries and sent as a single message at regular intervals:
- Avoids hitting Discord Webhook rate limits
- Prevents notification explosion during warning storms
- Aggregated view makes it easier to spot trends
Information Included in Notifications
Discord notifications automatically include:
- Component name and operation name
- Error message
- Source information (filename:line number + function name)
- Request ID, endpoint, method, remote IP
- Business data (user ID, event ID, payment ID, etc.)
With source information, you can identify exactly where in the code the problem occurred just from the notification.
GCP Cloud Monitoring
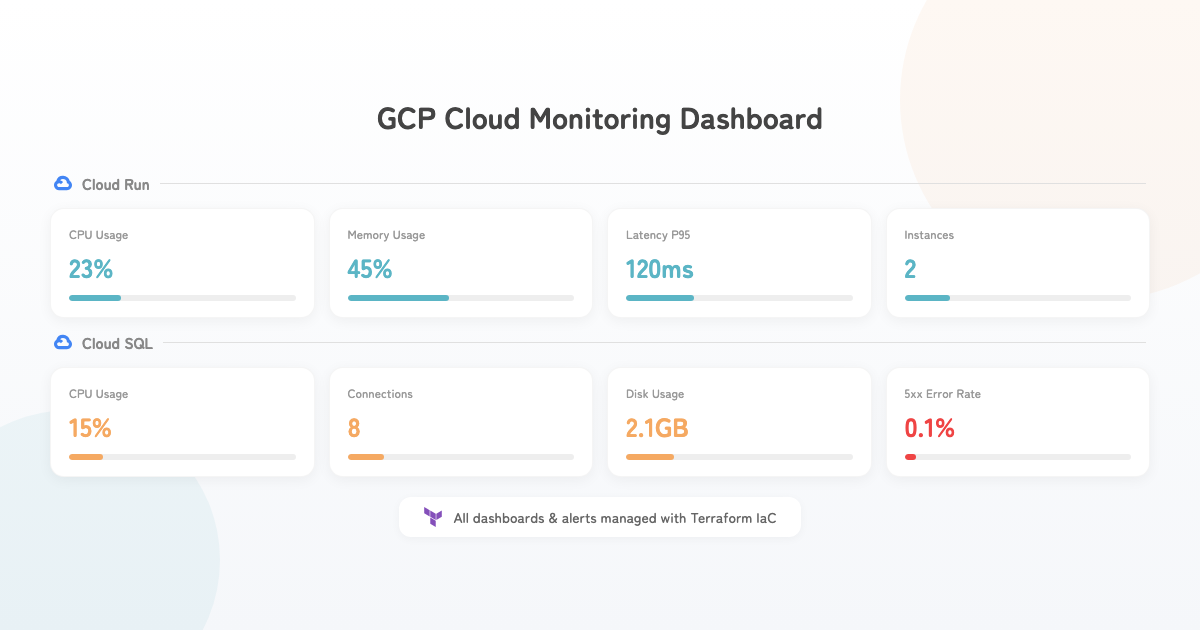
Terraform-Managed Dashboards and Alerts
All dashboards and alert policies are managed through Terraform. Code-based management ensures reproducibility and change history, rather than manual GCP Console configuration.
Dashboard Layout
A 12-tile dashboard visualizes the following:
| Category | Metrics |
|---|---|
| Cloud Run | CPU usage, memory usage, request count, latency (P95) |
| Cloud Run | Active instances, idle instances |
| Cloud SQL | CPU usage, connections, disk usage |
| Errors | 5xx error rate, 4xx vs 5xx breakdown, application error log count |
Alert Policies
The following alerts are defined in Terraform, triggering email notifications when thresholds are exceeded:
| Alert | Target | Purpose |
|---|---|---|
| CPU usage | Cloud Run | Performance degradation signals |
| Memory usage | Cloud Run | OOM risk |
| Response time | Cloud Run | User experience degradation |
| 5xx error rate | Cloud Run | Server error occurrence |
| 4xx error rate | Cloud Run | Spike in invalid requests |
| Active instances | Cloud Run | Unexpected scaling |
| Idle instances | Cloud Run | Wasted costs |
| CPU usage | Cloud SQL | Database load |
| Connections | Cloud SQL | Connection pool exhaustion |
| Disk usage | Cloud SQL | Storage pressure |
| App error count | Log-based metric | Application anomalies |
# Example: 5xx error rate alert
resource "google_monitoring_alert_policy" "error_rate" {
  display_name = "High Error Rate"

  conditions {
    display_name = "HTTP 5xx error rate"
    condition_threshold {
      filter     = "... metric.type=\"run.googleapis.com/request_count\" AND metric.label.response_code_class=\"5xx\""
      comparison = "COMPARISON_GT"
      threshold_value = var.error_rate_threshold

      aggregations {
        alignment_period   = "60s"
        per_series_aligner = "ALIGN_DELTA"
      }
    }
  }

  alert_strategy {
    auto_close = "86400s"
  }
}
All alerts have enable_xxx_alerts variables, allowing per-environment enable/disable control.
Log-Based Metrics
ERROR logs from Cloud Logging are converted into custom metrics and used as alert policy targets:
resource "google_logging_metric" "app_errors" {
  name   = "app_error_count"
  filter = "resource.type=\"cloud_run_revision\" AND severity=\"ERROR\""

  metric_descriptor {
    metric_kind  = "DELTA"
    value_type   = "INT64"
    display_name = "Application Error Count"
  }
}
This makes structured log ERROR output directly alertable through GCP.
Error Handler
func ErrorHandler() gin.HandlerFunc {
    return func(c *gin.Context) {
        c.Next()

        lastGinError := c.Errors.Last()
        if lastGinError == nil {
            return
        }

        var appErr *shared.AppError
        if errors.As(lastGinError.Err, &appErr) {
            if gin.Mode() == gin.ReleaseMode {
                // Production: error code and generic message only
                c.JSON(appErr.Status, shared.AppError{
                    Code:    appErr.Code,
                    Message: "An unexpected error occurred.",
                })
            } else {
                // Development: detailed error information
                c.JSON(appErr.Status, appErr)
            }
            return
        }
    }
}- Production hides internal error details from responses (security)
- Development returns detailed error information (debugging efficiency)
- All errors are recorded in structured logs (traceability)
Admin Web App
A dedicated admin web app (React + TypeScript) provides visibility into service health:
- Payment analytics: revenue trends, success rates, daily breakdowns, event rankings
- System statistics: real-time user count, event count, participant count
- Event management: event status monitoring and operational controls
This surfaces business metrics that are difficult to track through the GCP Console alone.
Conclusion
Here’s a summary of the monitoring stack:
| Layer | System | Purpose |
|---|---|---|
| Application | Structured logging (slog) | Root cause identification |
| Application | Request ID | Cross-request tracing |
| Application | Error handler | Appropriate prod/dev responses |
| Notification | Discord error/warn alerts | Immediate anomaly detection |
| Infrastructure | GCP Cloud Monitoring | Resource usage visibility |
| Infrastructure | Alert policies (Terraform) | Automated threshold detection |
| Business | Admin web app | Business metrics visibility |
Building something that works is just the beginning. Keeping it running reliably requires monitoring infrastructure like this. As a solo developer, building systems that detect problems even when you’re not watching is essential.